Remote Debug in Go (nvim + delve + docker)
I don’t know where to start this whole story from. As a preface, I must acknowledge that my primary experience years ago has been in Python development, utilizing tools such as pip for package management, a framework for organization, and virtualenv for environment management. Lately, I’ve added Docker to the mix as well.
Recently, a new career opportunity presented itself and I was given the opportunity to choose the tools for the job. Given the requirement for speed and high concurrency, I saw it as a perfect fit for a go-lang application. I embarked on extensive research and testing to determine the best tools to support my development workflow.
After careful consideration, testing, and analysis of various projects and codebases, I have reached a understanding of the flexibility that go language offers in terms of project organization. I faced the challenge of breaking away from my prior OOP experience and adapting to the lack of strict guidelines in go, which was both enjoyable and difficult. Through studies and observations, I have developed the ability to structure the skel to best suit the requirements of the project.
Given that my unwavering red line from the start was to work with Docker, it has been a very enjoyable challenge to make the entire stack dependent on containers. However there was a last step in the stack that was holding out: the debugging tools.
Previously I was familiar with using pdb for debugging, so my needs were relatively straightforward. I was seeking a tool to set breakpoints, inspect variables, and halt/resume execution. Initially, I considered gdb as an option, but after reviewing the documentation, I discovered that the developers recommend delve as a superior alternative. Based on this recommendation, I decided to proceed with using delve.
To use delve with a Go application in a container, you need to run delve in the container, which allows you to control the execution of your binary by listening to remote procedure call (RPC) connections. This way, you can perform actions like stopping the execution, observing variables, and stepping through the code line by line…
- The binary must be executed using
dlv(delve). - A communication channel needs to be established for server-client interaction.
- We need a client that connects to the server and sends commands.
- Ideally, we would like to have an interface within our editor to manage the process.
- And don’t forget that all the developments is dockerized.
Delve, Air and Docker
The Docker setup includes two services, one for the main application and another for testing. The app and tests services in the Docker setup are distinct, with differing environment variables and thus separate databases. The entrypoints for each service are separate, with the app service running the main application and the tests service running the tests (obviously). To handle code changes, tools like fresh and air were utilized, the entrypoint is configured to run air with a specific set of parameters (.air.toml):
root = "."
cmd = "go build -o ./tmp/main main.go"
bin = "tmp/main"
include_ext = ["go", "tpl", "tmpl", "html"]
The current directory (.) is mounted as a volume in the Docker container, and air is configured to monitor changes to specific file extensions, triggering a rebuild and serving the updated code. For dlv debugging, the binary must be run under delve, which requires installing dlv in the container. The way the binary is executed may need to be adjusted accordingly (modified .air.toml):
root = "."
cmd = "go build -gcflags=all=\"-N -l\" -o ./tmp/main main.go"
bin = "tmp/main"
full_bin = "dlv exec --accept-multiclient --log --headless --continue --listen="0.0.0.0:40000" --api-version=2 ./tmp/main"
include_ext = ["go", "tpl", "tmpl", "html"]
It’s important for this approach to work to remember to include the installation of air and dlv in your container’s Dockerfile:
FROM golang:1.19-alpine

WORKDIR /code

RUN apk add build-base gcc-go musl-dev && \
    go install github.com/cosmtrek/air && \
    go install github.com/go-delve/delve/cmd/dlv@latest
[...]
It appears to have potential, however, there is a new network port that we need to factor in, so we need to change our docker-compose either and open both ports, appart from other options as SYS_PTRACE and seccomp/apparmor:unconfined:
services:
  app:
    build: .
    cap_add:
        - SYS_PTRACE
    security_opt:
        - seccomp:unconfined
        - apparmor:unconfined
    [...]
    command: ["air"]
    ports:
        - 1234:1234
        - 40000:40000
    volumes:
        - ./:/code
    [...]
Once the container has been rebuilt, we can verify that the changes are working as expected just trying to connect with dlv (client) from the host to the dlv (server) container. Of course you need to install dlv in the host too:
$ dlv connect 0.0.0.0:40000
Type 'help' for list of commands.
(dlv)
We can now add breakpoints and continue debugging from the command line interface, which is similar to using pdb in the Python world. However, it may be worth exploring further options.
Neovim
What do you think about having a visually appealing and straightforward debugging interface in an editor like neovim?. Will try!. I’ve considered two ways: dap + dap-go or vim-go on the other hand. I’ve tried both but only got something usable with vim-go, I think the dap thing is the future but it still has a lot of room for the improvement, because there are some stuff that is not fully supported.
First of all we need to install vim-go, it depends on your package manager, in my case all I had to do was to add Plug 'fatih/vim-go' to my configuration file. Once the plugin is installed there is another little trick we should handle, the substitute paths. Most likely your working directories will not match between your development environment and the container, so we’ll have to tell vim-go to rewrite those paths so that, for example, if you want to set a breakpoint in the file /home/oscar/code/sample/main.go, it knows you are referring to the file /code/main.go in the container.
:let g:go_debug_substitute_paths = [['/code', '/home/oscar/code/sample']]
Another point to consider when opening a debug session with vim-go is to indicate that it will be remote, so we will need the host and port in the same way as we have previously done with the execution of dlv from the console:
:let g:go_debug_address = '0.0.0.0:40000'
Now we are ready to start a debug session and enjoy the debugging experience:
:GoDebugConnect
If everything has gone correctly, the debugging interface will open with a new layout:
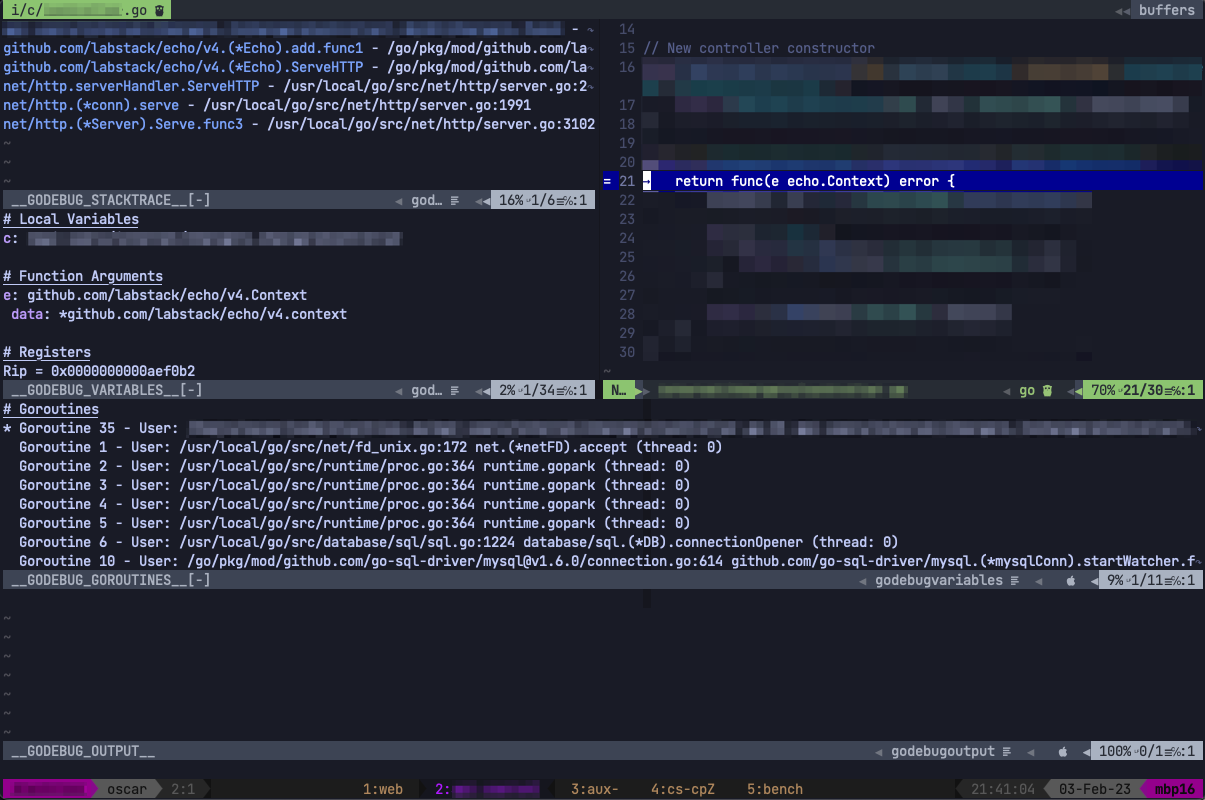
Problems
The solution is not perfect, as I’ve commented with the dap cocktail (nvim-dap, nvim-dap-go, nvim-dap-ui…) I wasn’t able to substitute the paths, so in the end the I couldn’t set breakpoints because the file was not matching. I was able to resolve it with vim-go, but there are still some small issues I haven’t figured out how to solve.
For example, there are many times when after establishing the connection (:GoDebugConnect) and when trying to set the first breakpoint, it takes too long to respond and eventually gives an error:
vim-go: could not toggle breakpoint: Vim(let):E716: Key not present in Dictionary: "result.Breakpoint"
If during that response time, you manually open dlv connect 0.0.0.0:40000 in another terminal, the error disappears and it continues to work. I haven’t found an explanation for this yet.